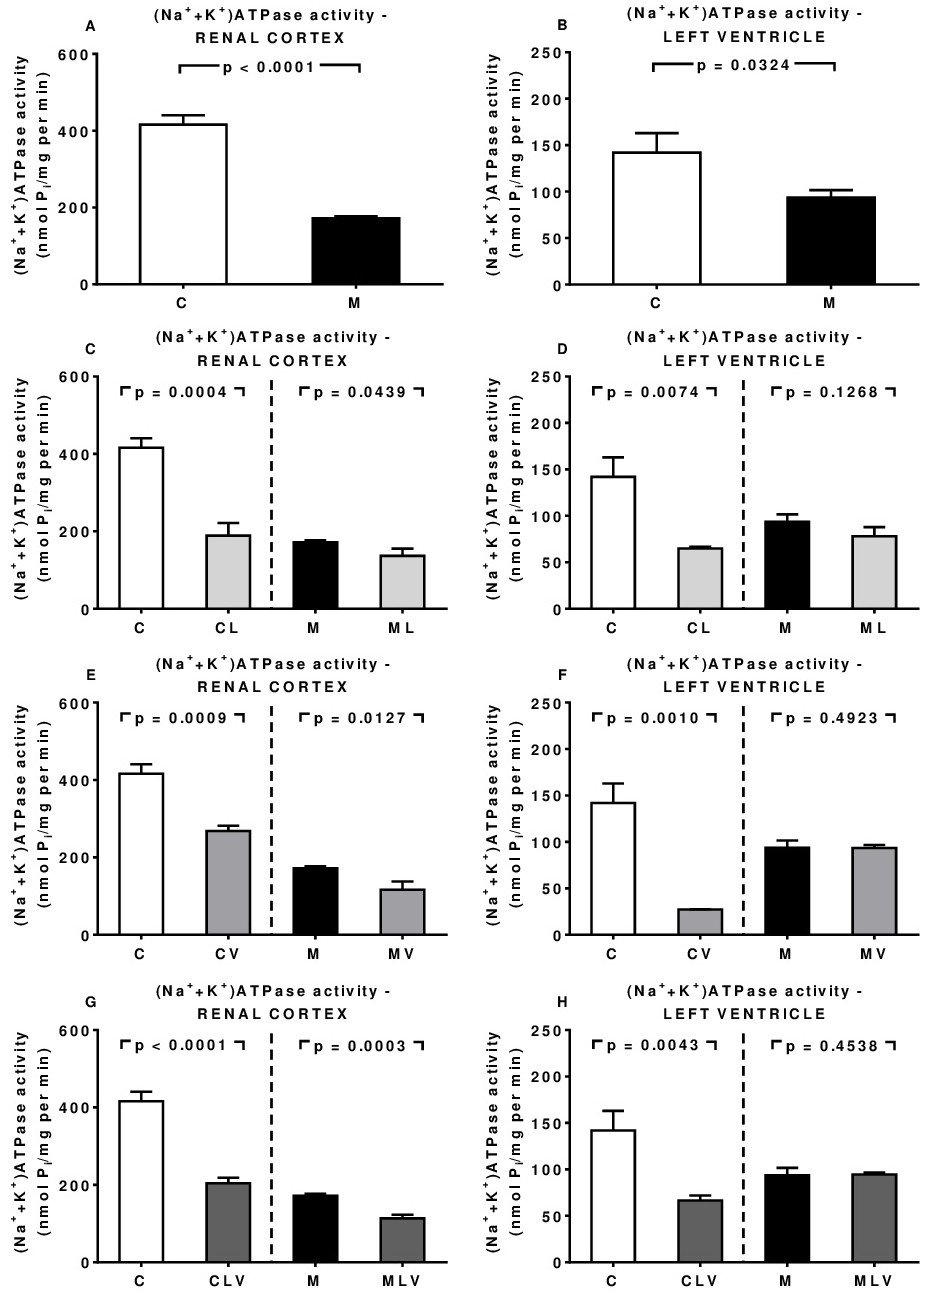
Fig. 5. (Na++K+)ATPase activity from proximal tubule cells and cardiomyocytes are similarly downregulated in chronically malnourished rats, but respond differently to pharmacological treatments. Panels A and B show (Na++K+)ATPase activity in basolateral membranes from renal cortex corticis tubules and plasma membranes from left ventricle cardiomyocytes, respectively. Empty bars: normonourished rats (C); black bars: malnourished rats (M). Vertical dashed lines separate normonourished and malnourished groups in the rest of the panels. The left sections correspond to normonourished rats; the right sections correspond to malnourished rats. Abbreviations of the groups are indicated on the abscissae, according to the nutritional status and the timeline of pharmacological interventions with Losartan, Valproate or a combination of both drugs, as described in the text and in Supplementary Table 1. The data are mean ± SEM (n = 4-5). Differences were assessed by Student's t-test. The p values are indicated within the panels.